kms_bench
Violin Plot
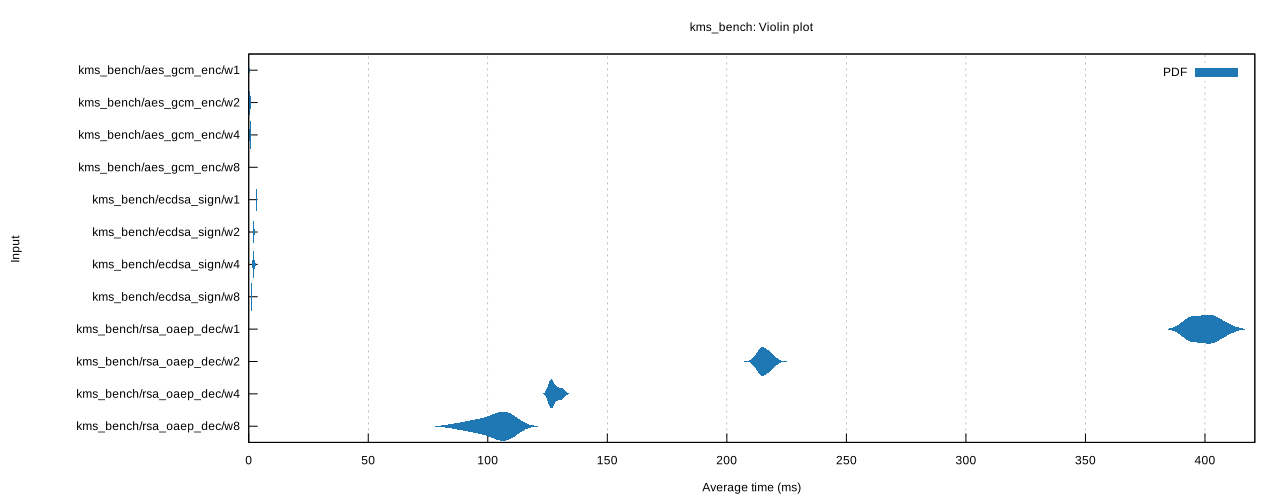
This chart shows the relationship between function/parameter and iteration time. The thickness of the shaded region indicates the probability that a measurement of the given function/parameter would take a particular length of time.
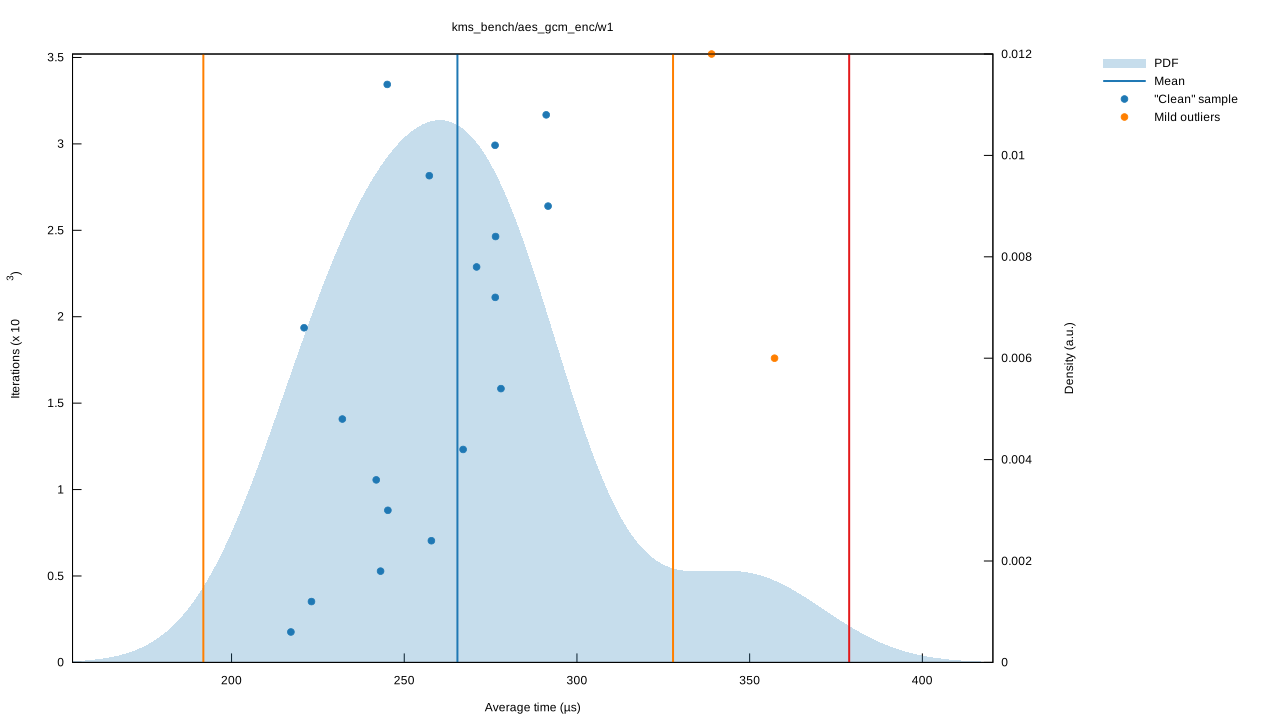
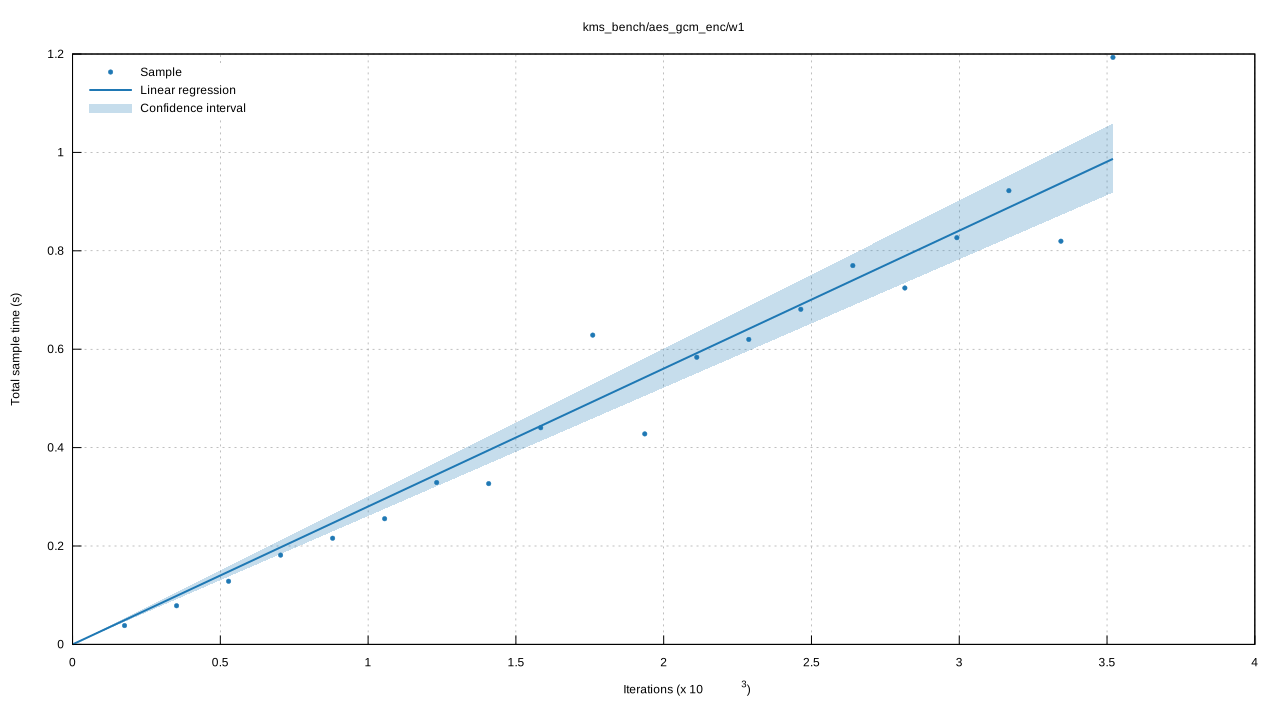
kms_bench/aes_gcm_enc/w1
|
|
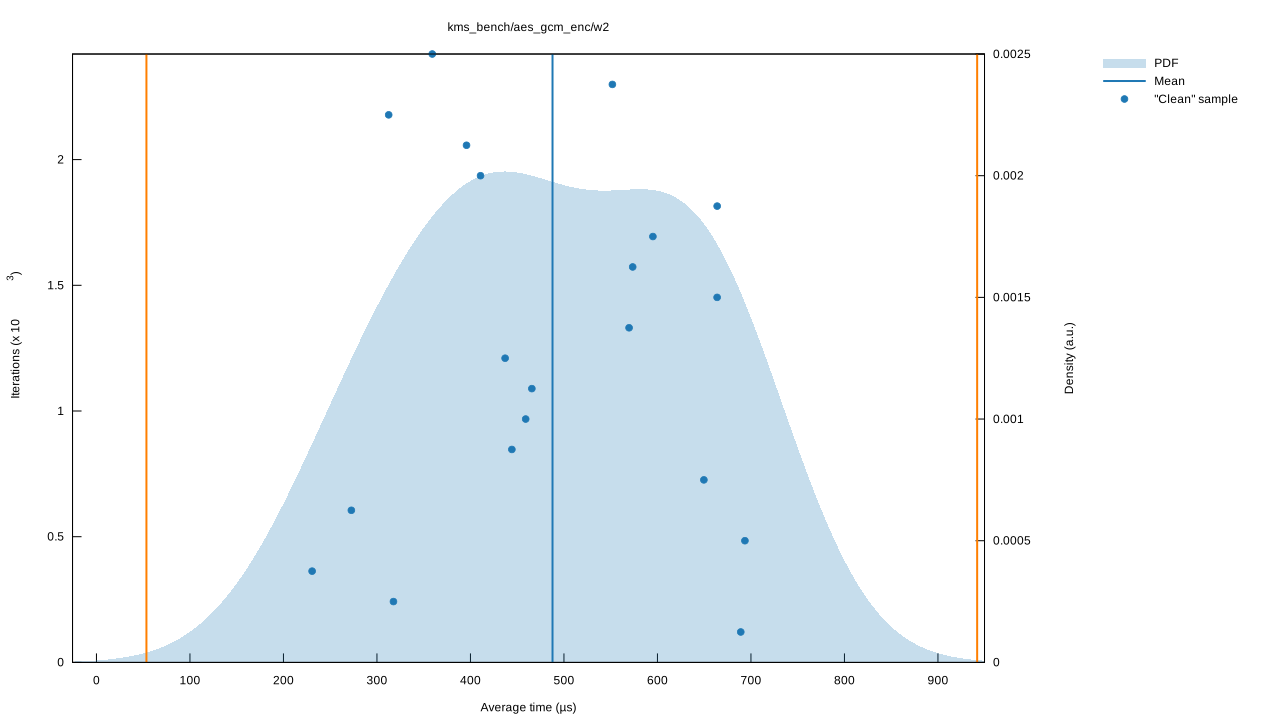
kms_bench/aes_gcm_enc/w2
|
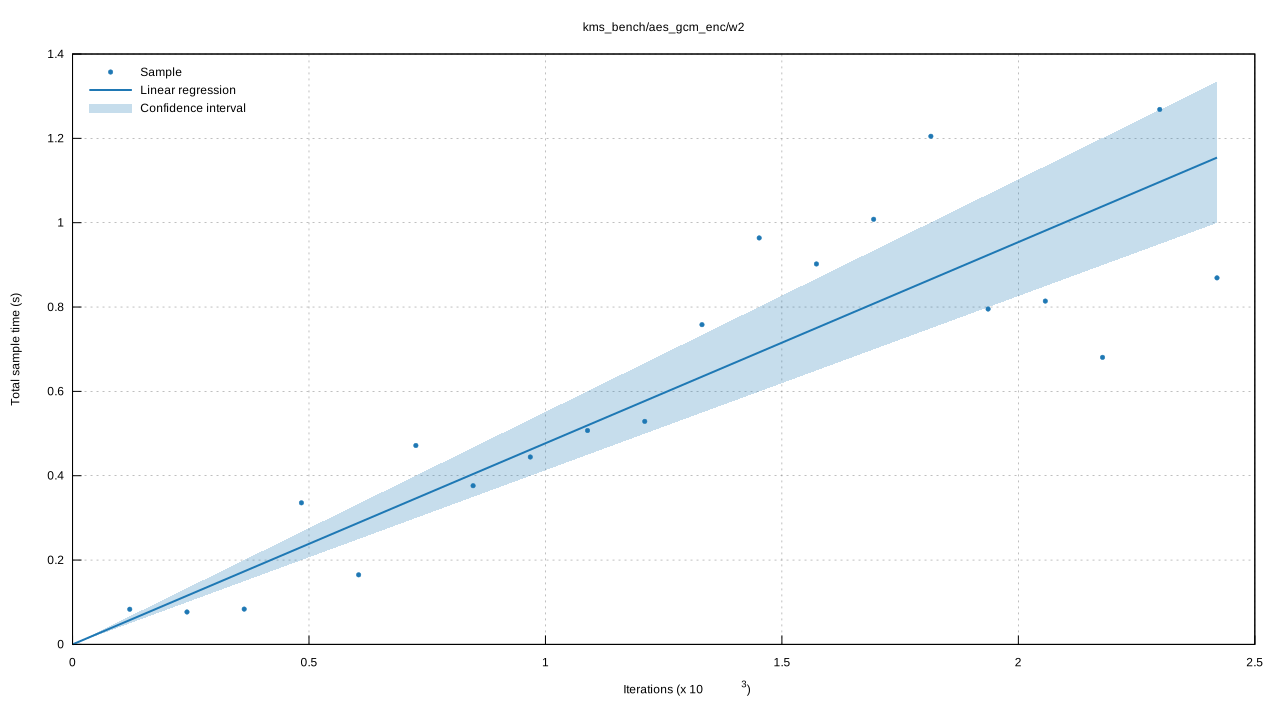
|
kms_bench/aes_gcm_enc/w4
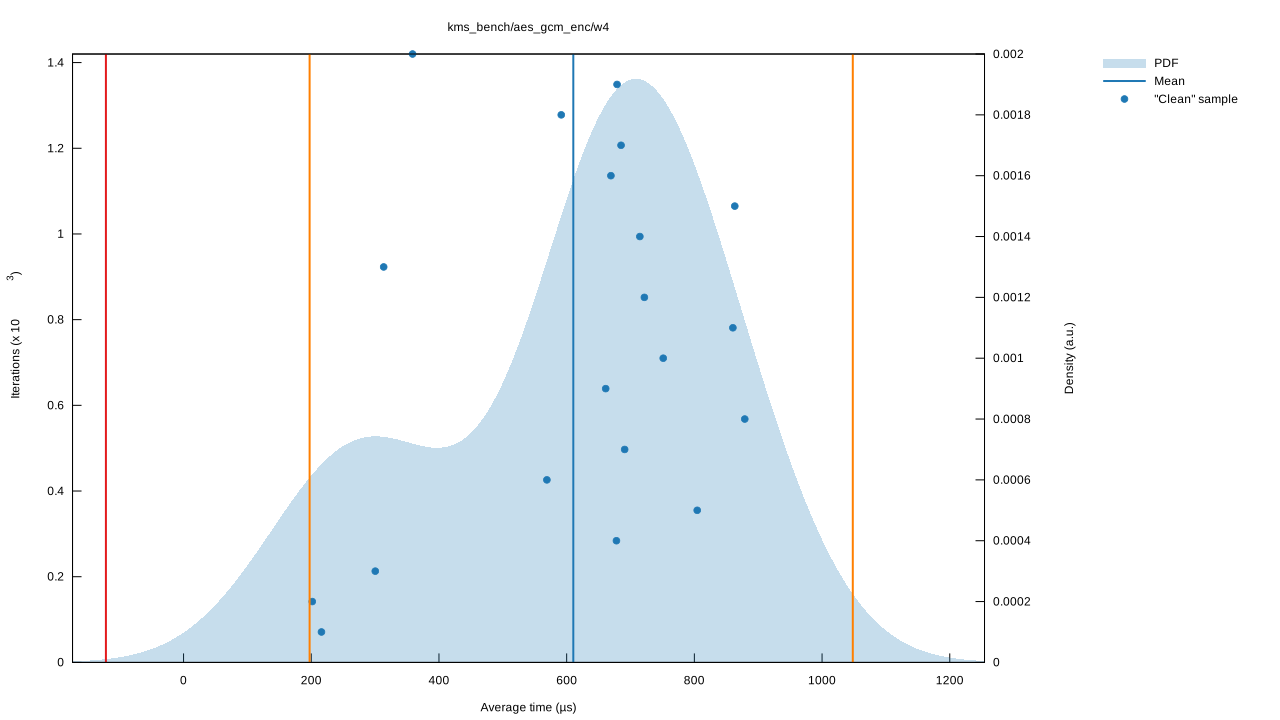
|
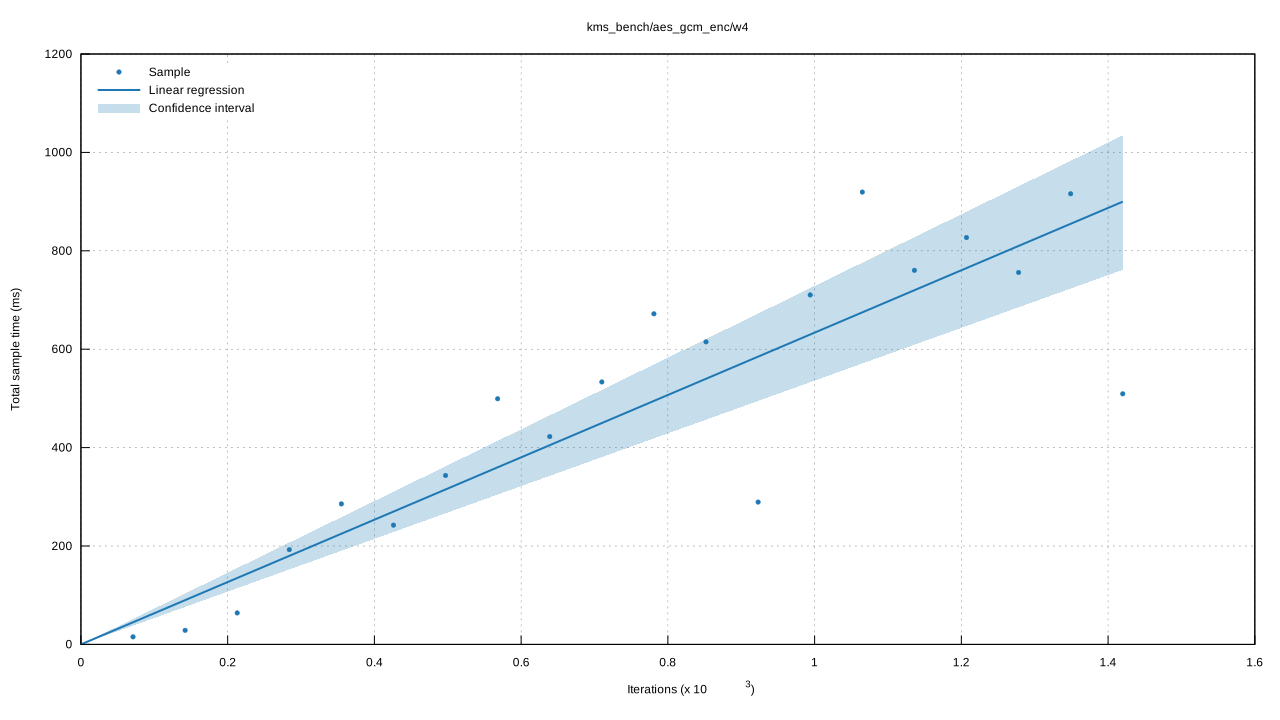
|
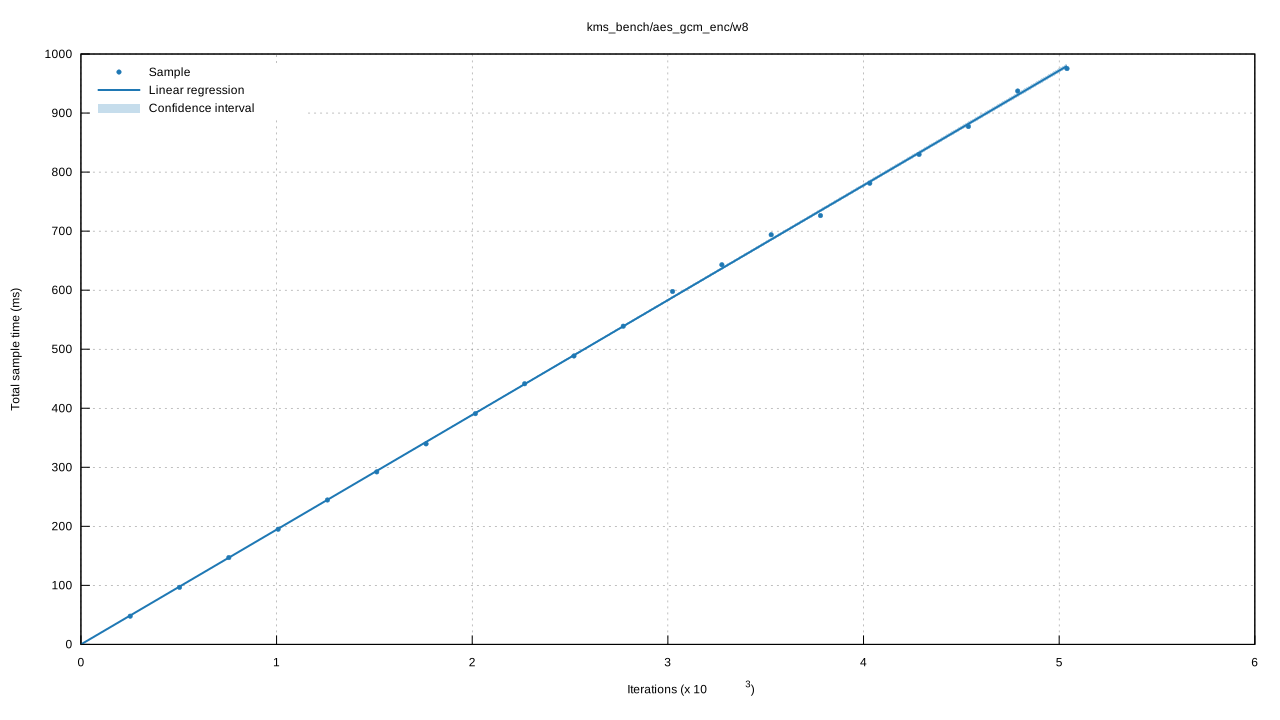
kms_bench/aes_gcm_enc/w8
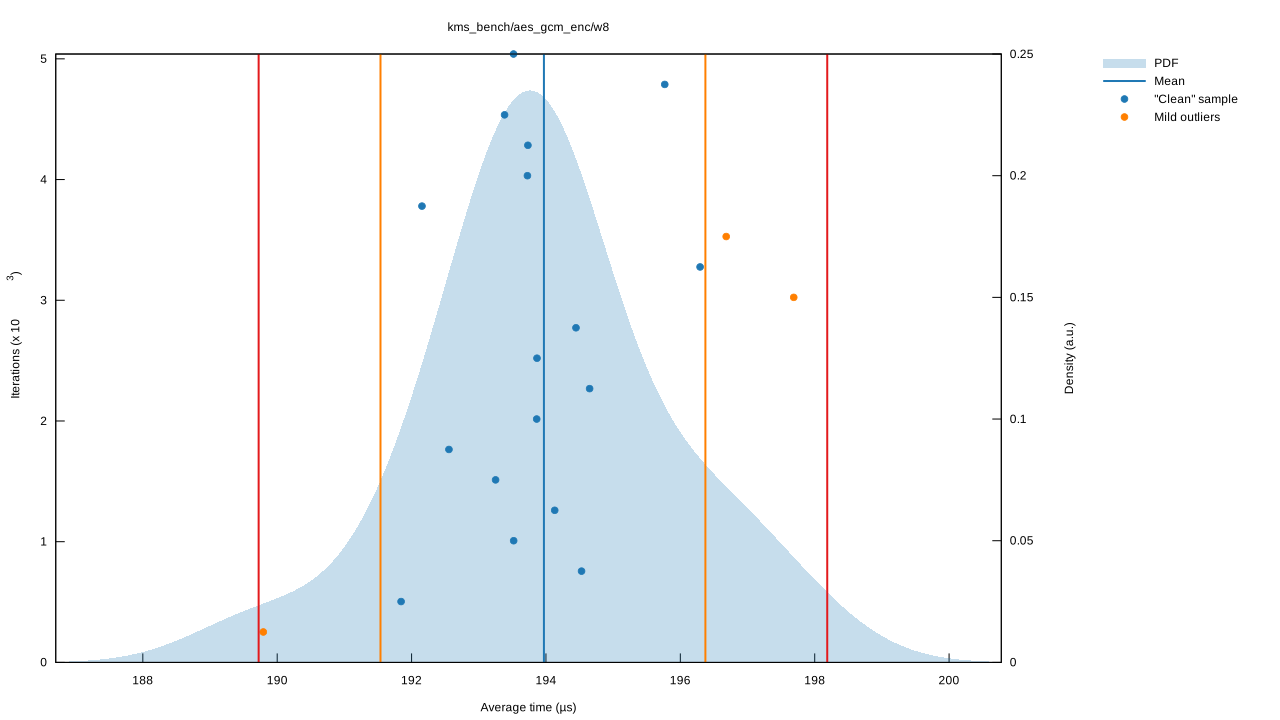
|
|
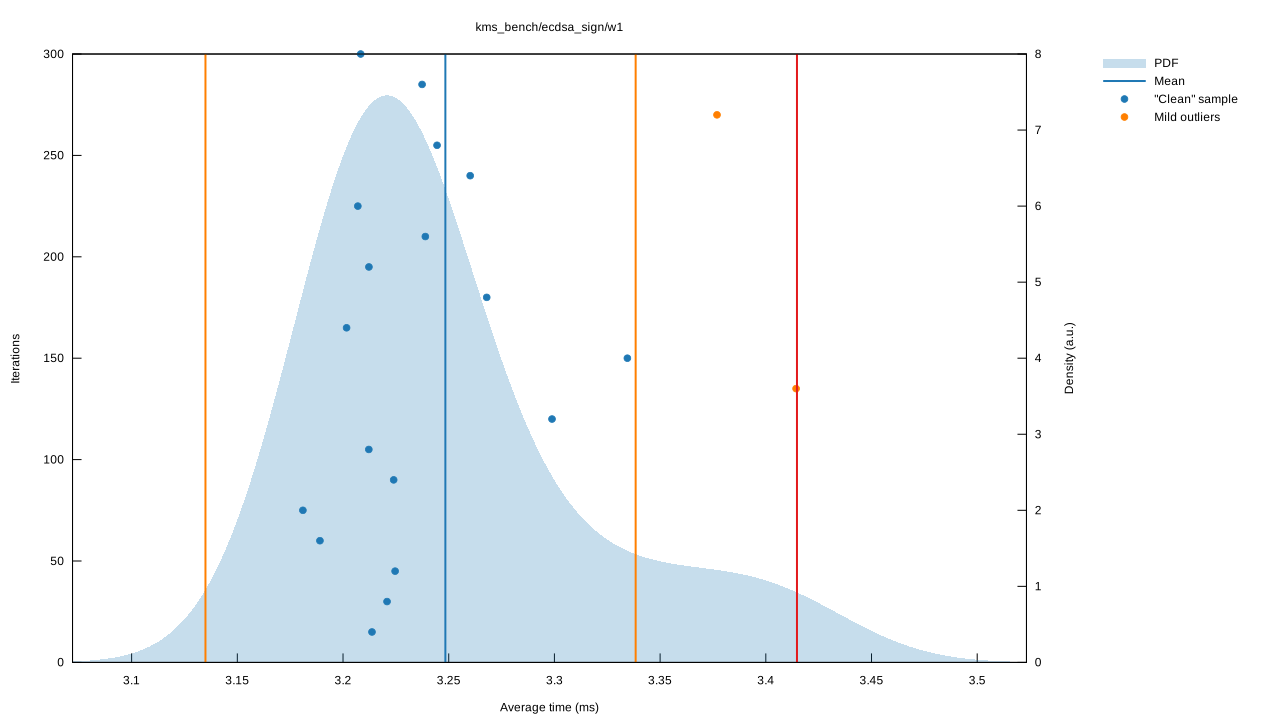
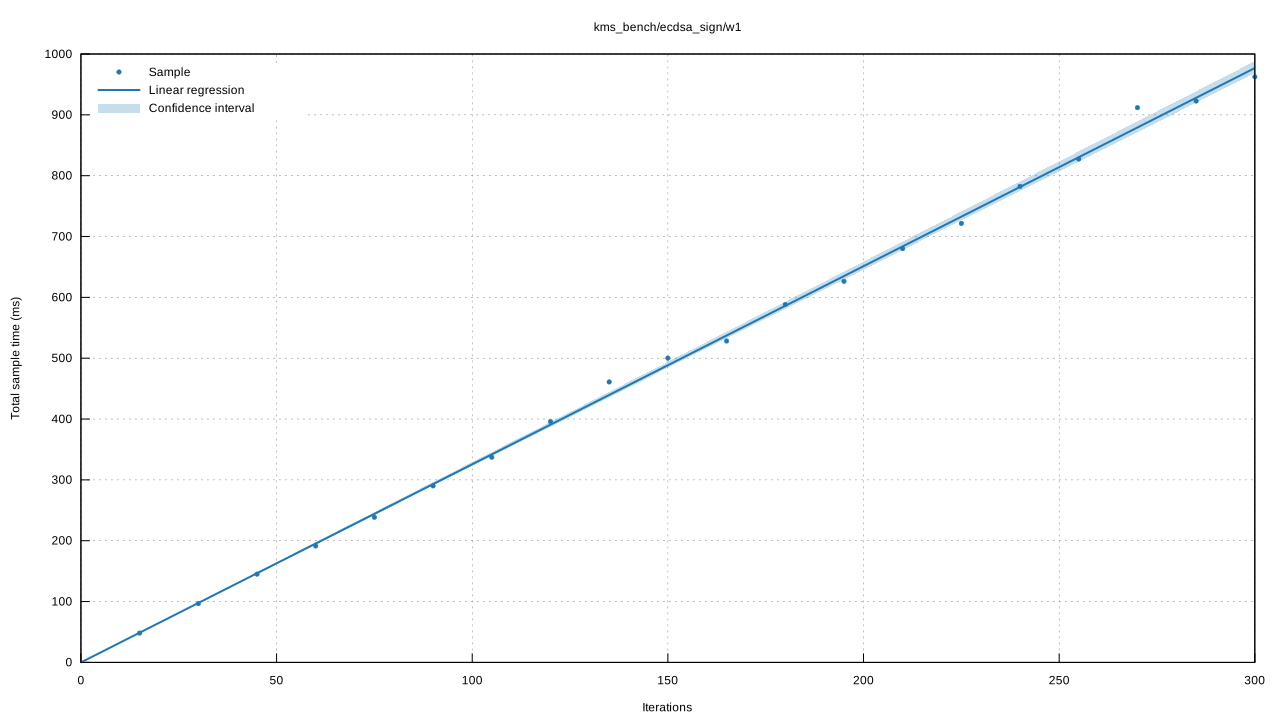
kms_bench/ecdsa_sign/w1
|
|
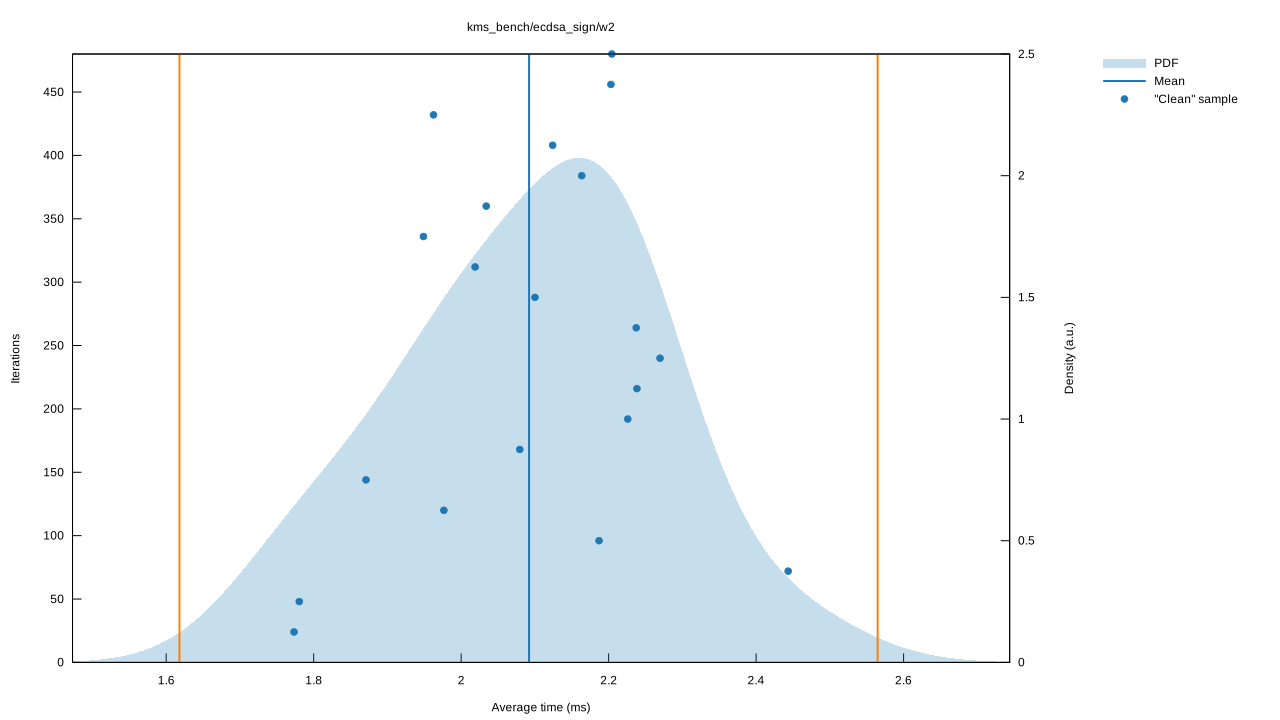
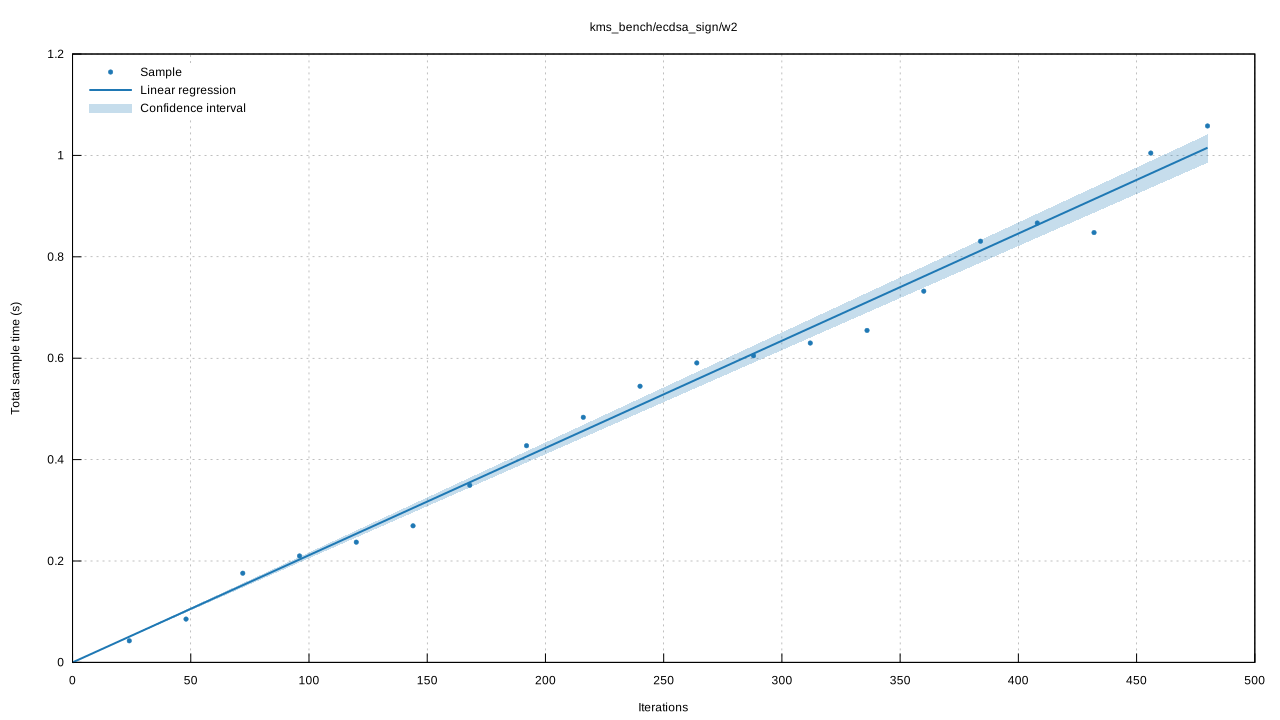
kms_bench/ecdsa_sign/w2
|
|
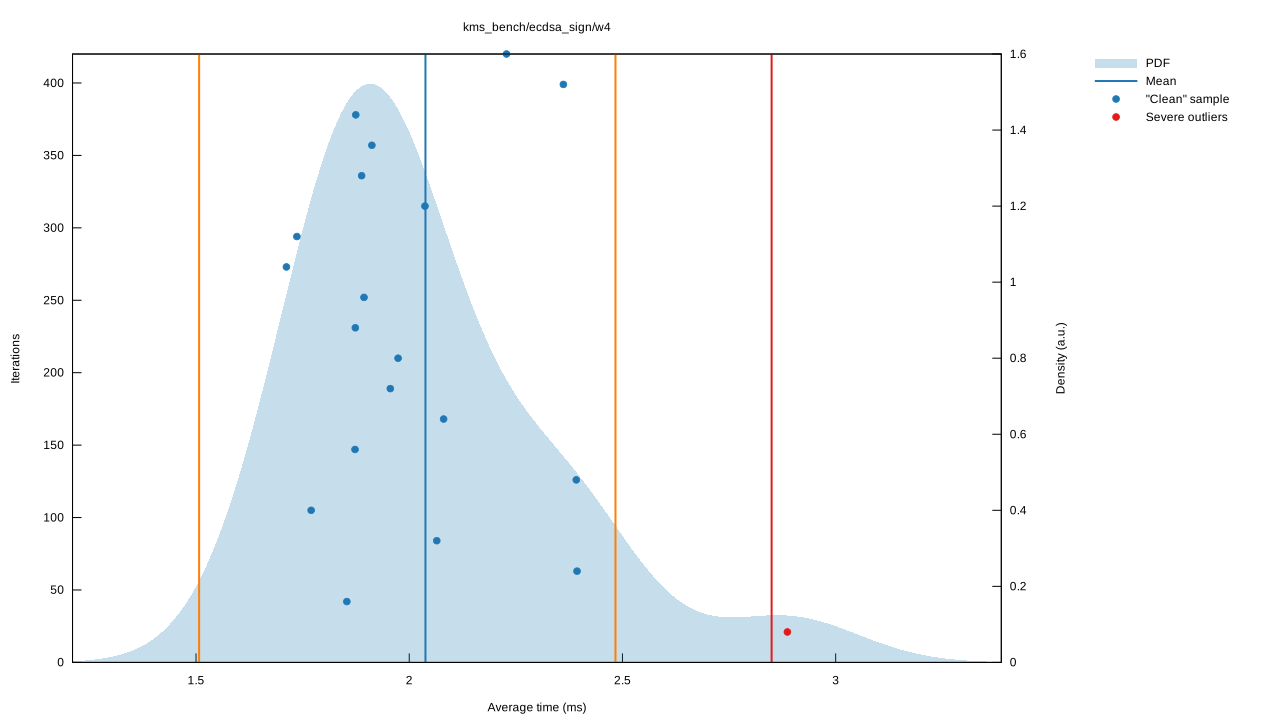
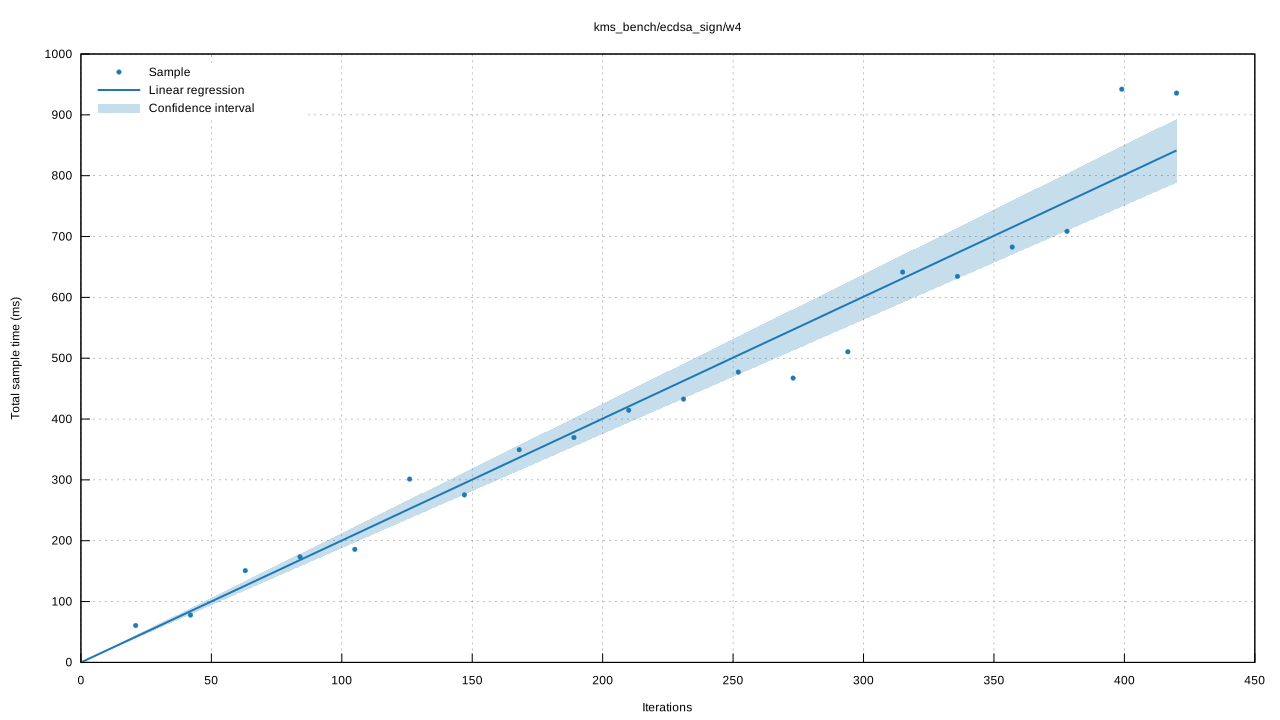
kms_bench/ecdsa_sign/w4
|
|
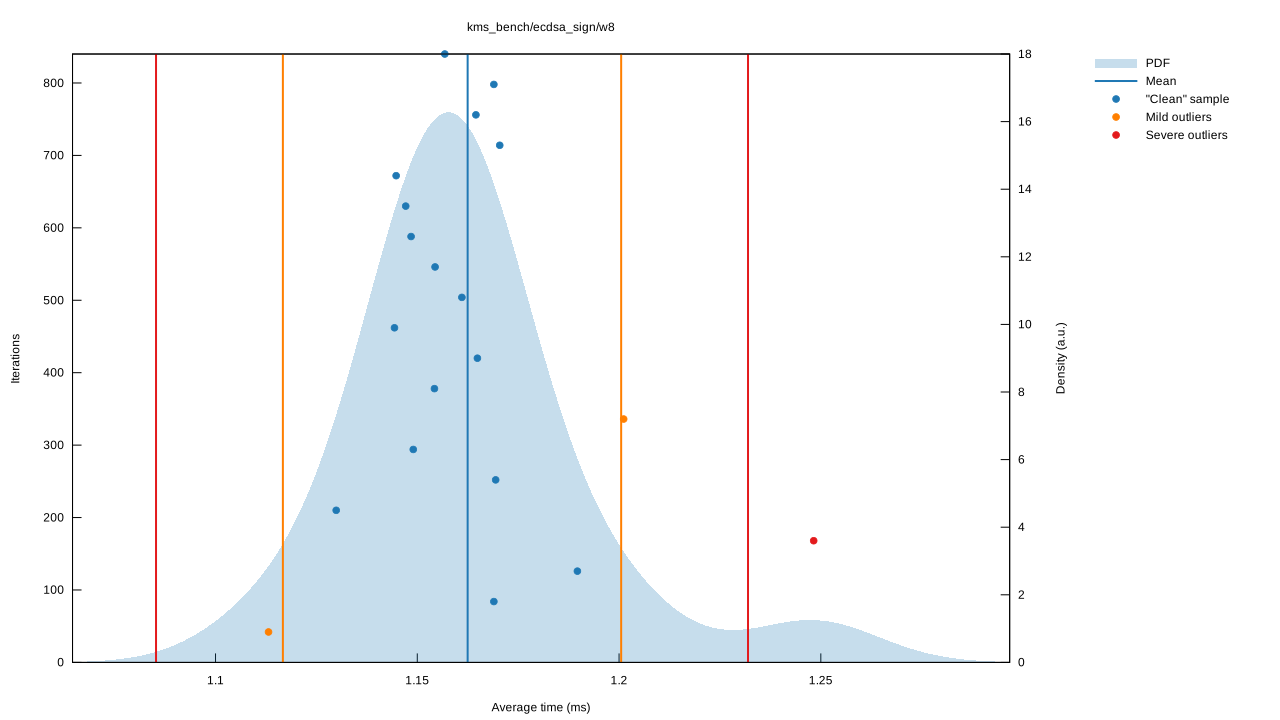
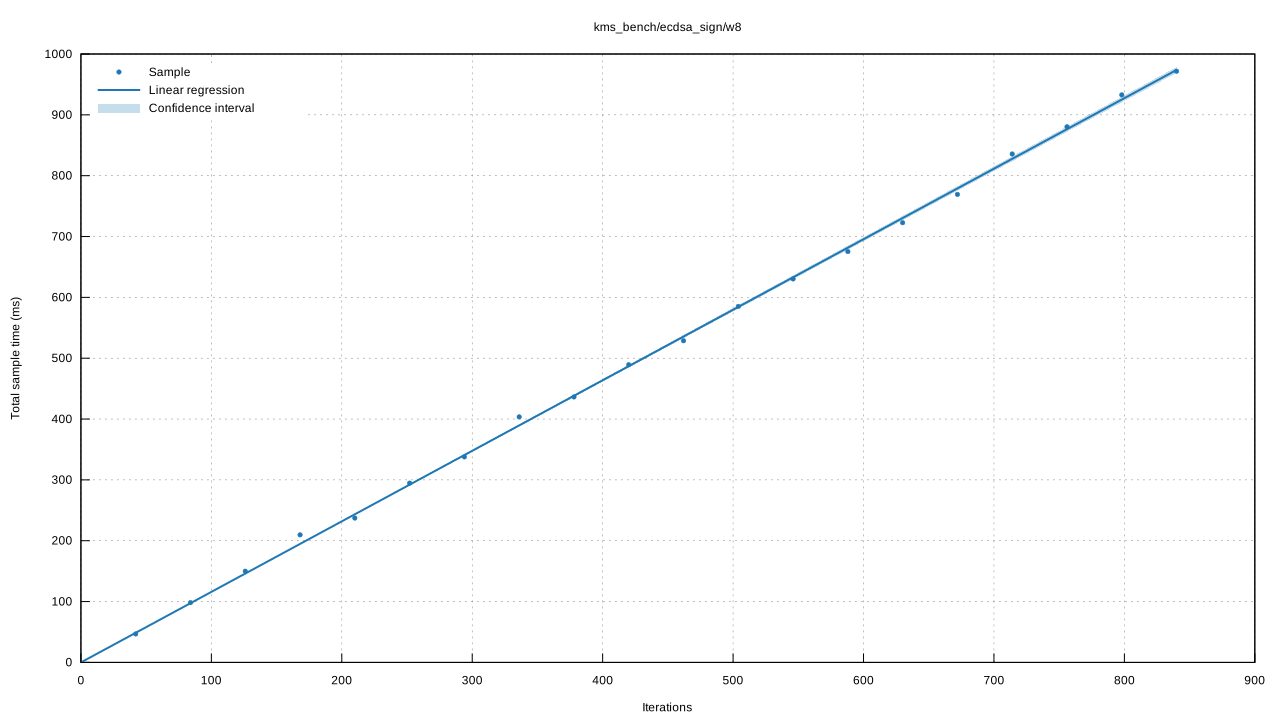
kms_bench/ecdsa_sign/w8
|
|
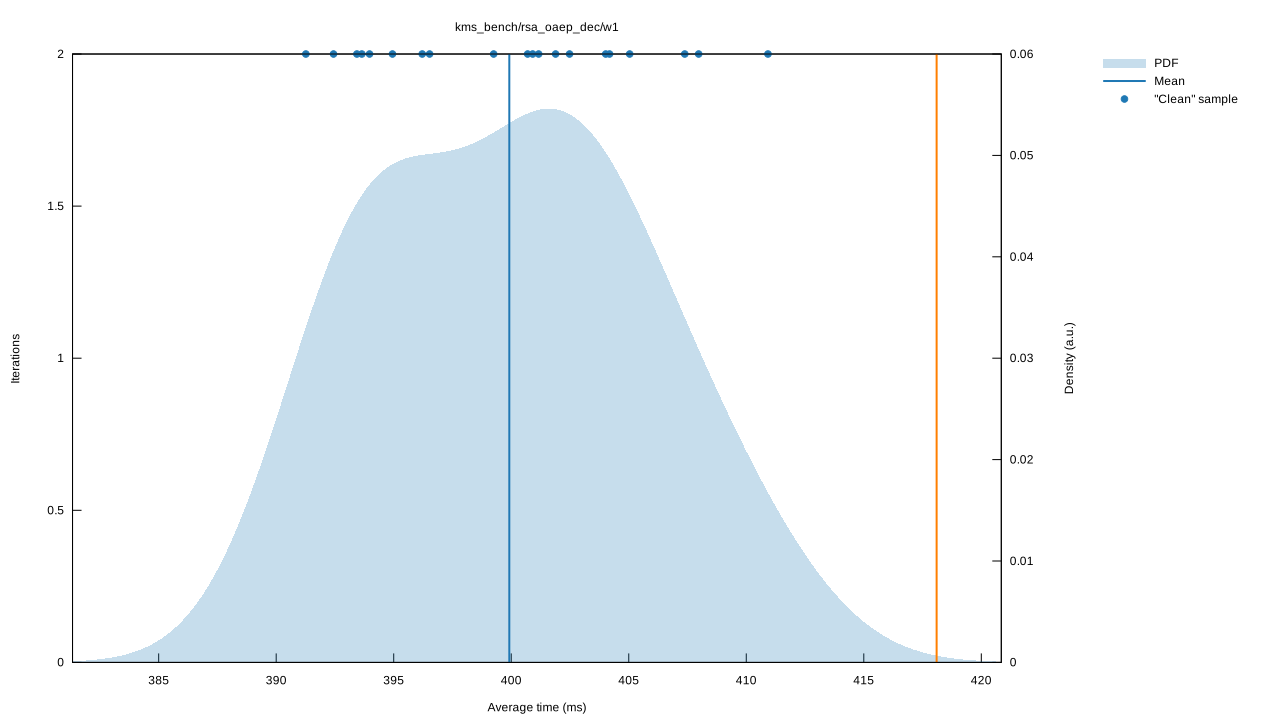
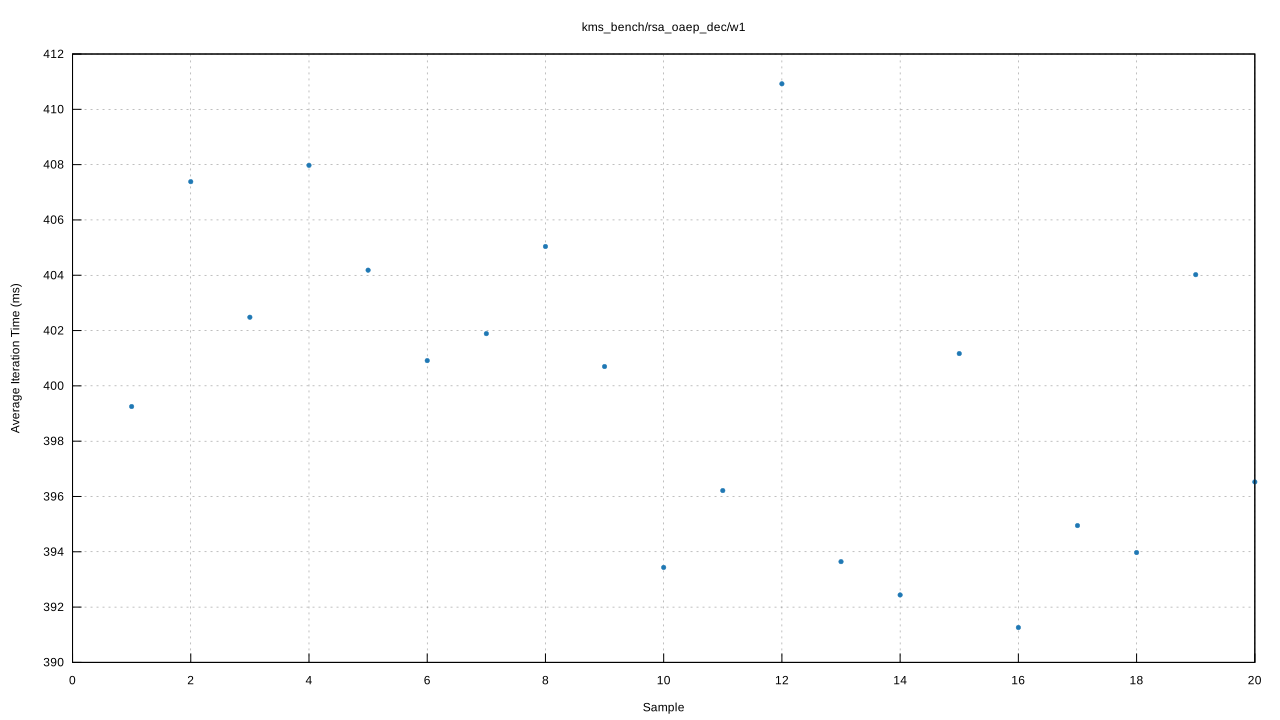
kms_bench/rsa_oaep_dec/w1
|
|
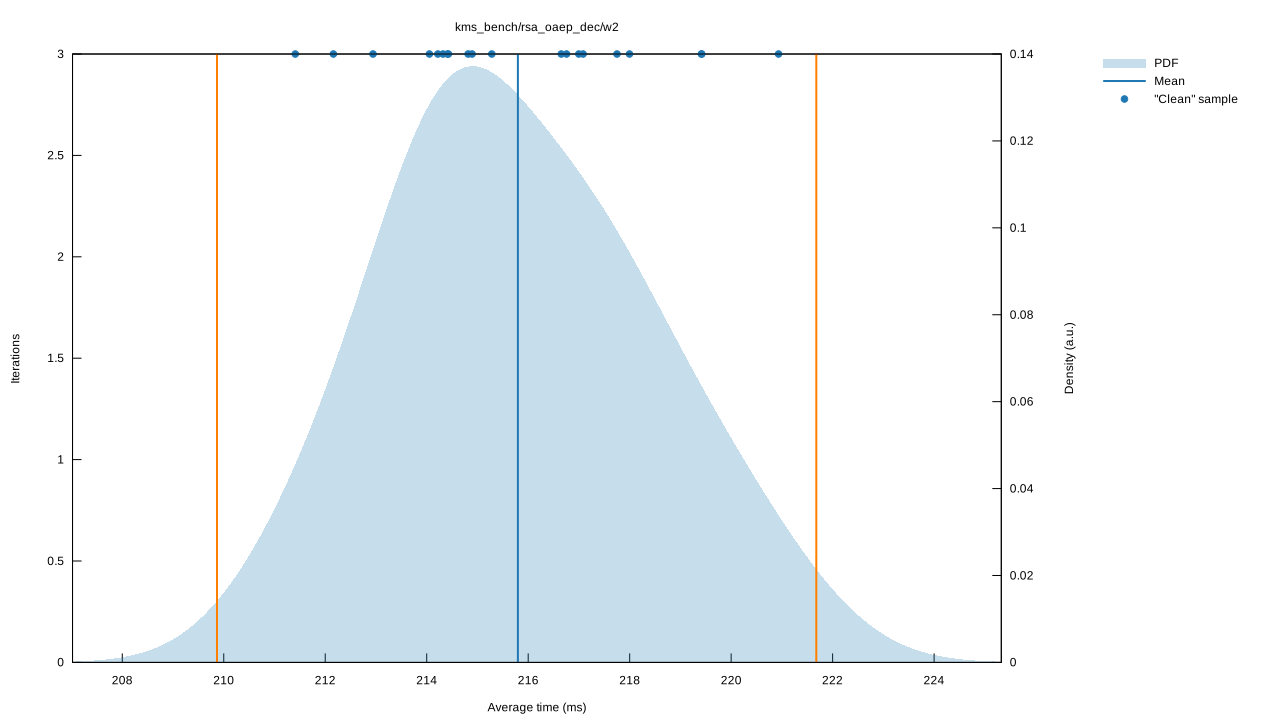
kms_bench/rsa_oaep_dec/w2
|
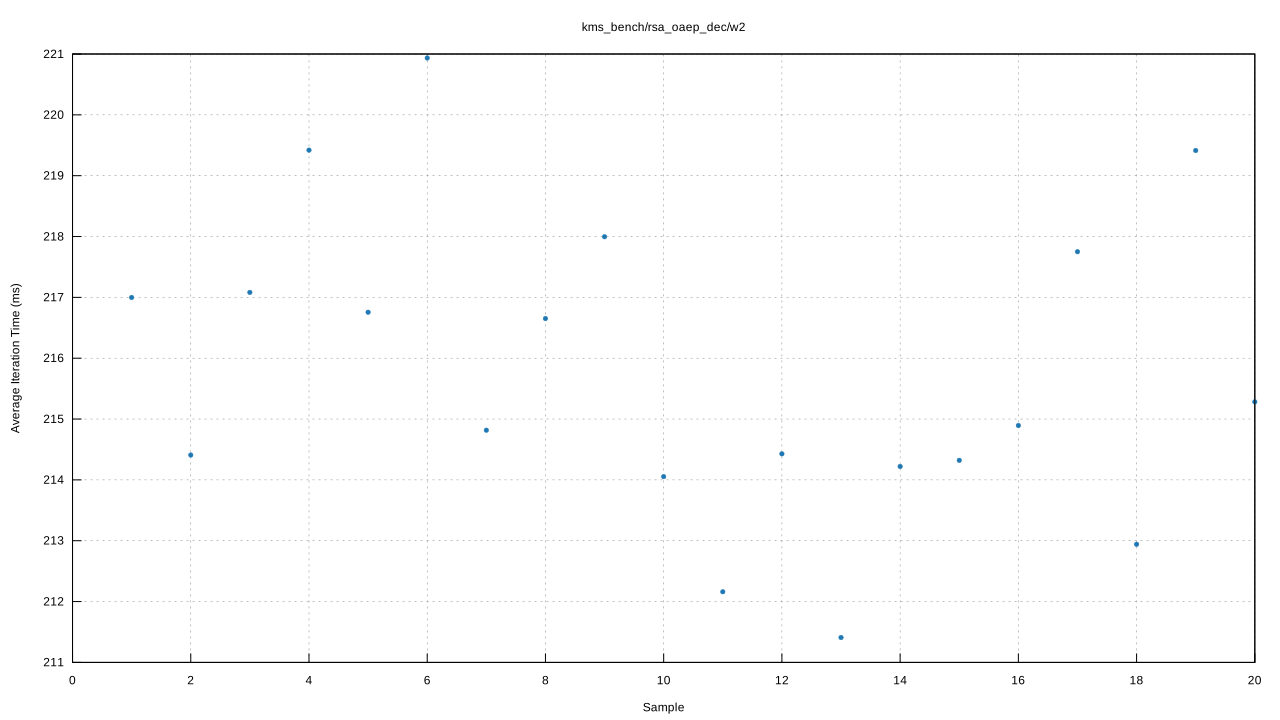
|
kms_bench/rsa_oaep_dec/w4
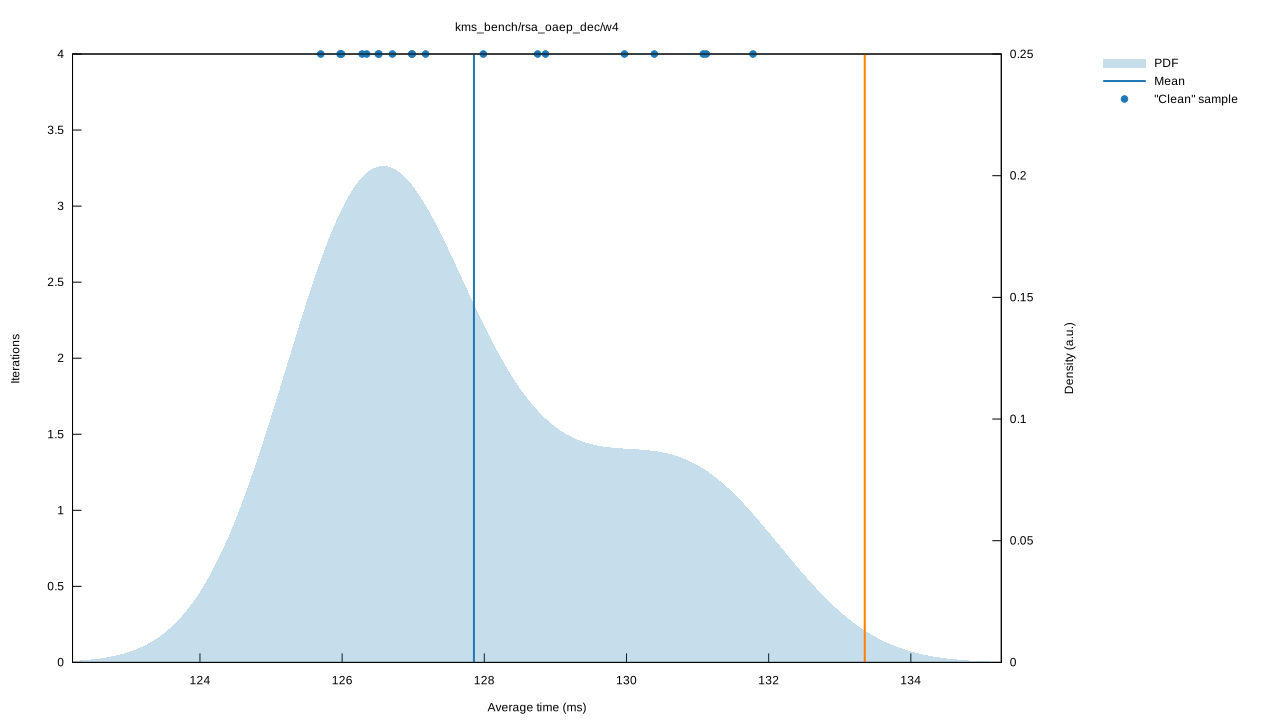
|
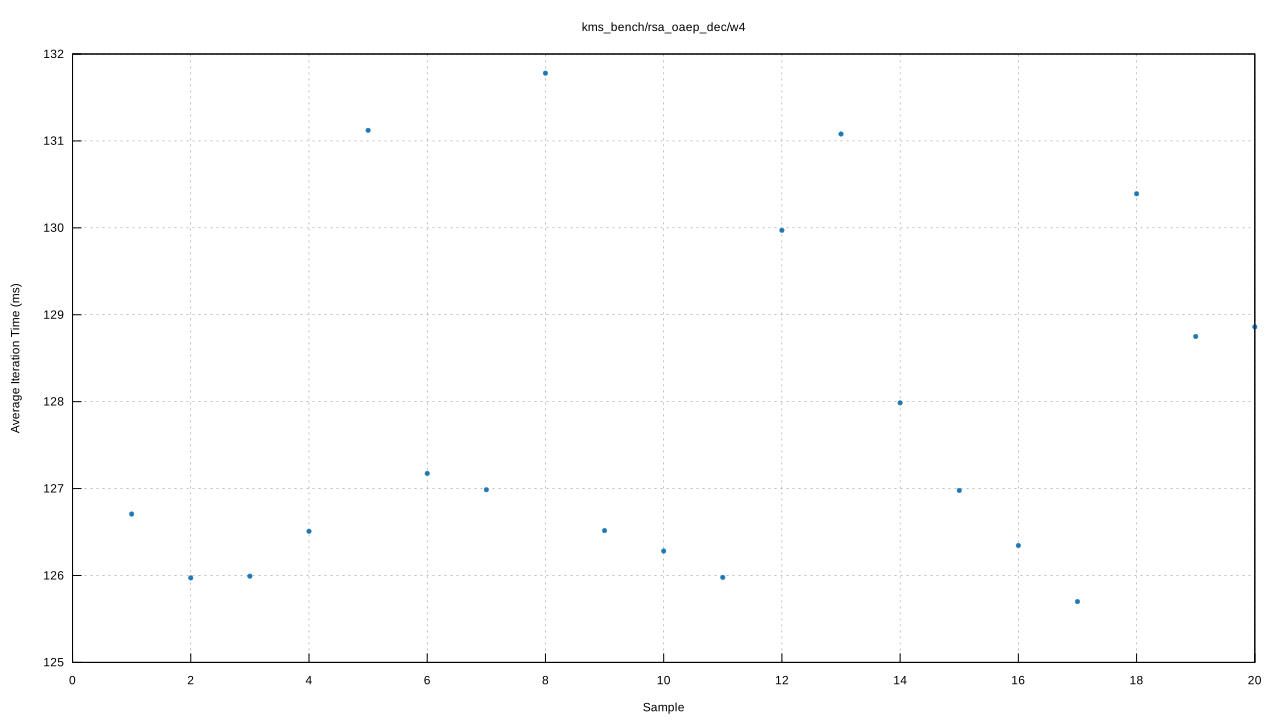
|
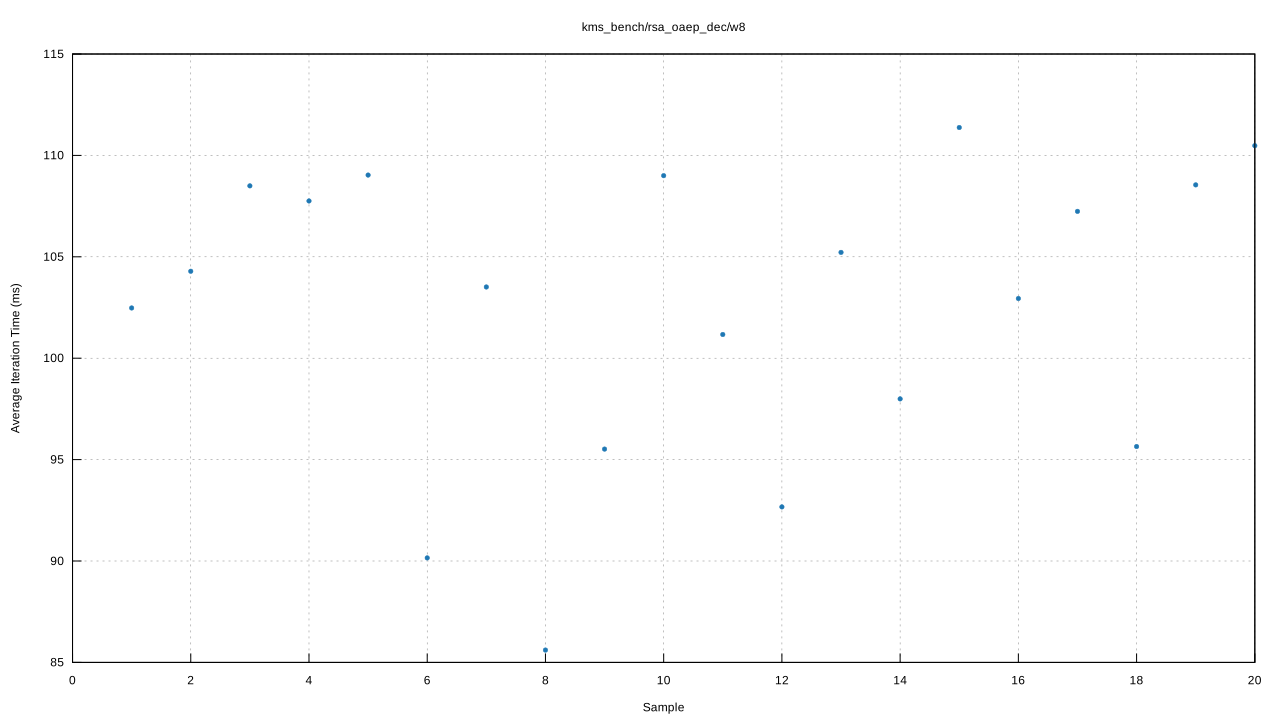
kms_bench/rsa_oaep_dec/w8
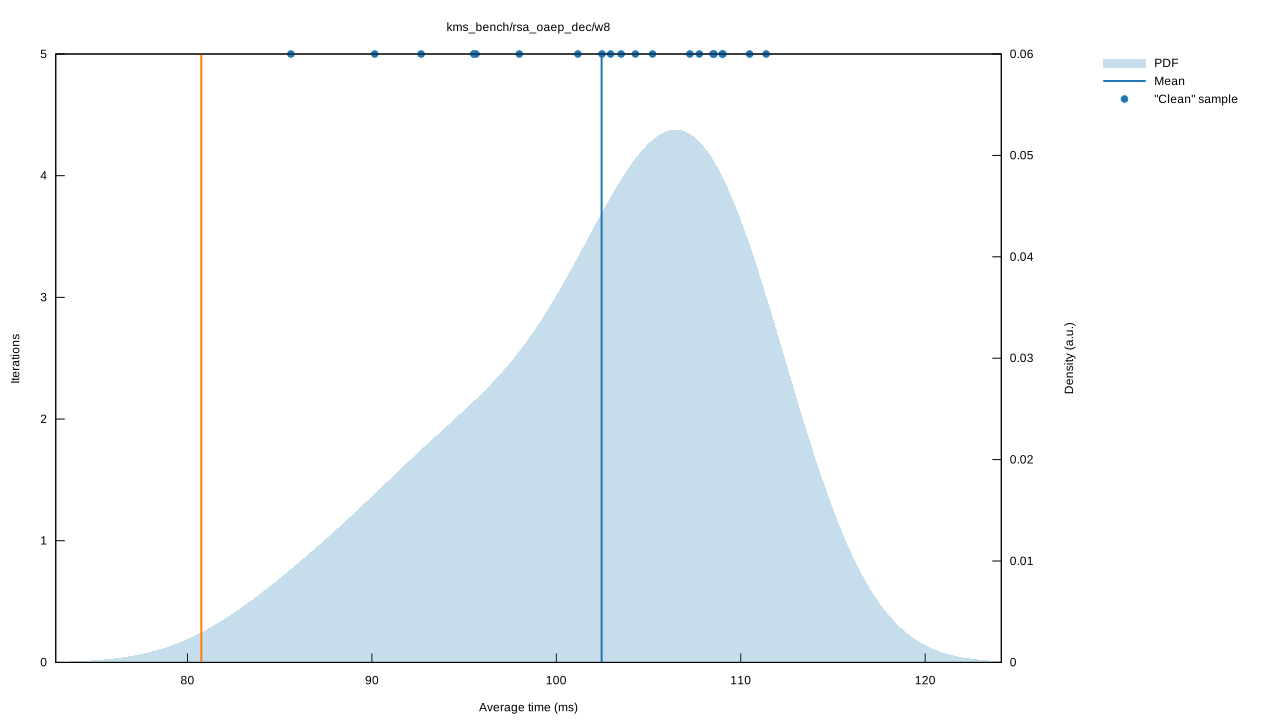
|
|